# Discovery HTTP interface
Discovery’s HTTP interface provides a web-management interface and two metric end-points. The web-management interface provides you with a central overview of licensing, component connectivity, and key performance metrics in your deployment. The metric end-points provide performance metrics in Prometheus and JSON format.
## Web interface
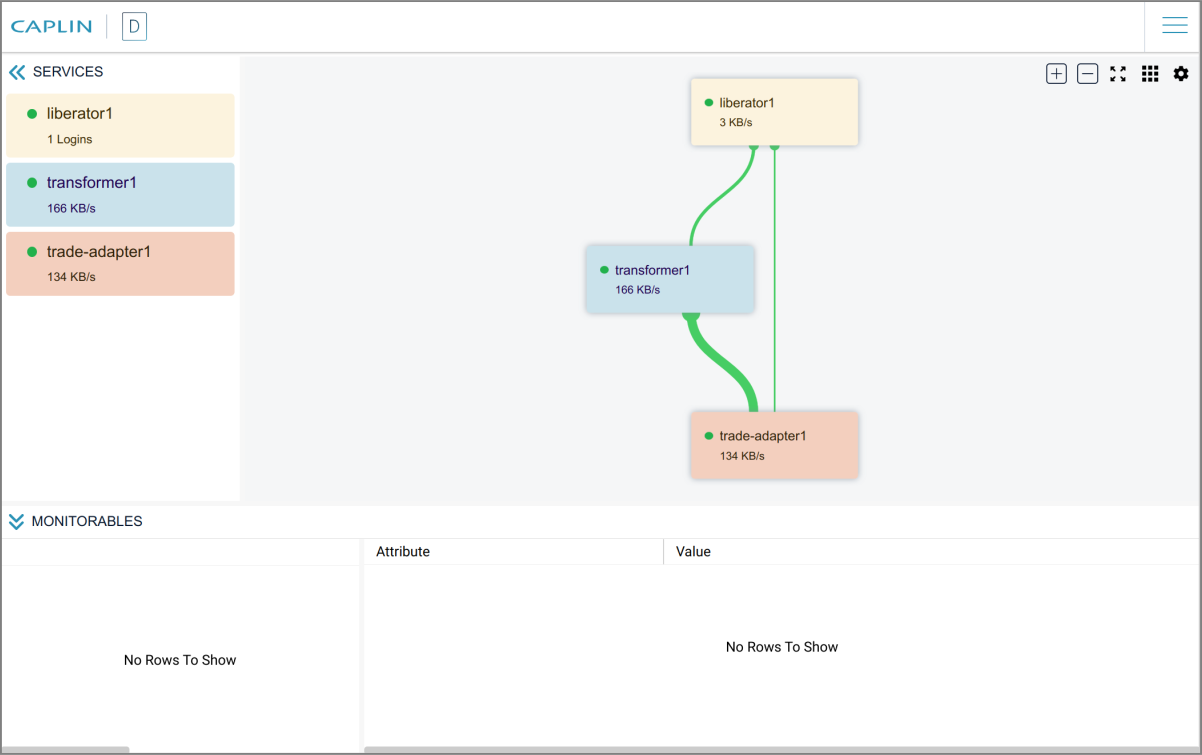
Discovery’s web interface provides a visualisation of the components in your deployment, the connections between them, and key performance metrics.
**Discovery web interface**
### Services pane
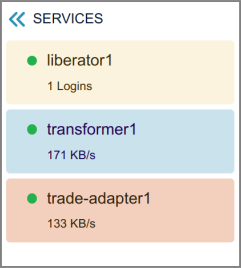
The Services pane lists all components connected to Discovery, with DataSource I/O rates (sent + received) displayed for all components except Liberator, which displays the number of current logins. I/O rates for Liberator are displayed in the connectivity diagram.
**Services pane**
### Connectivity diagram
The connectivity diagram illustrates components and the connections between them. Each component displays a DataSource I/O rate (sent + received) and a status disc indicating whether the component is UP or DOWN.
**Connectivity diagram**
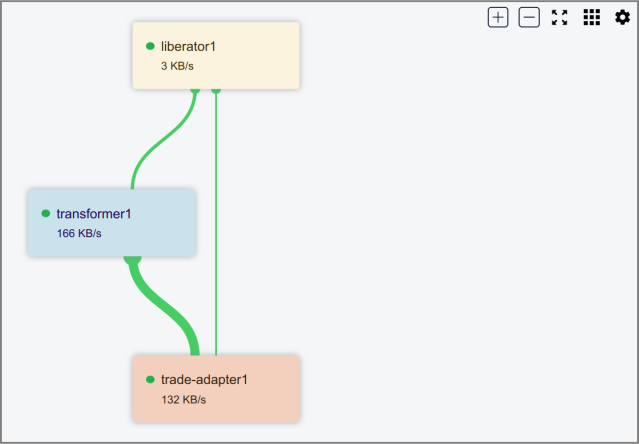
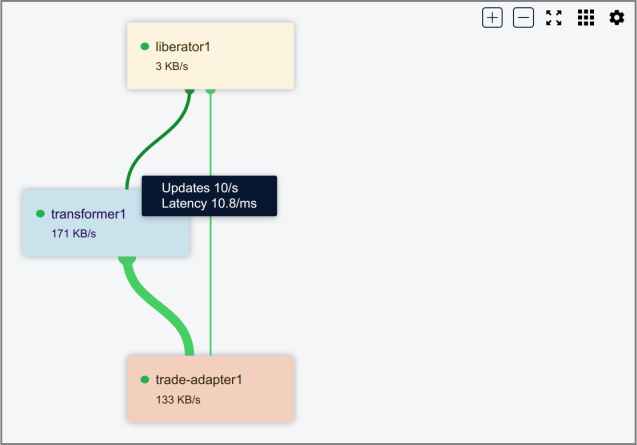
The thickness of connecting lines provides a graphical representation data throughput. Hover over a connection to reveal a tooltip with metrics for throughput (updates per second) and latency (milliseconds).
**Connection metrics**
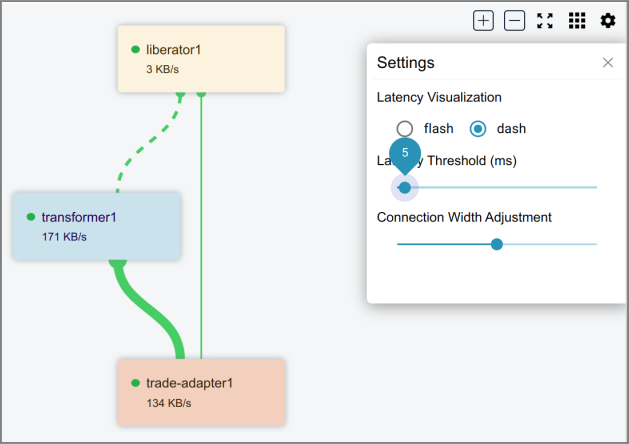
Connecting lines can also provide visual warnings of latency bottlenecks. Click the cog icon ( icon:cog[] ) to open the **Settings** panel for the diagram. Set a **Latency Threshold (ms)** and choose a **Latency Visualisation** method.
In the screenshot below, the **Latency Threshold** has been set to 5ms and the **Latency Visualisation** method set to 'dash'. The latency between Transformer and Liberator is 10.5ms, which exceeds the new threshold, and so the connection is rendered as a dashed line.
**Settings panel with a latency threshold of 5ms**
### Monitorables pane
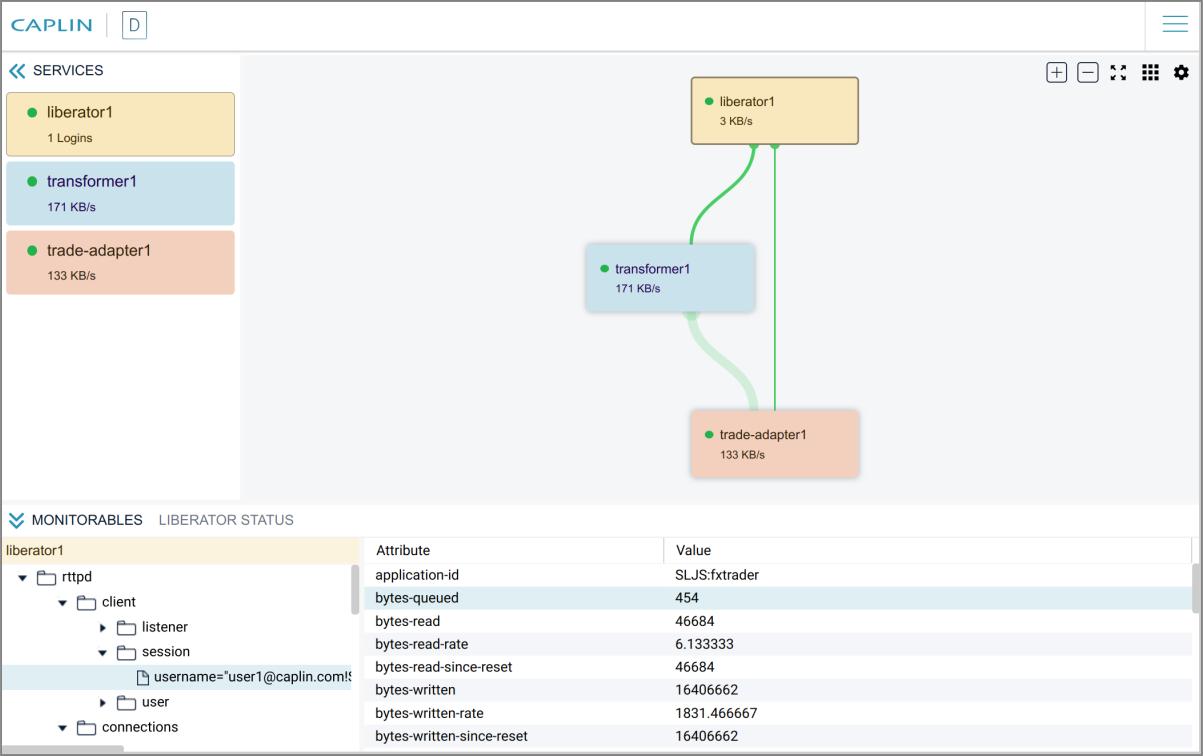
Click on a component in the Services pane or Connectivity diagram for detailed metrics on the component.
**Monitorables pane**
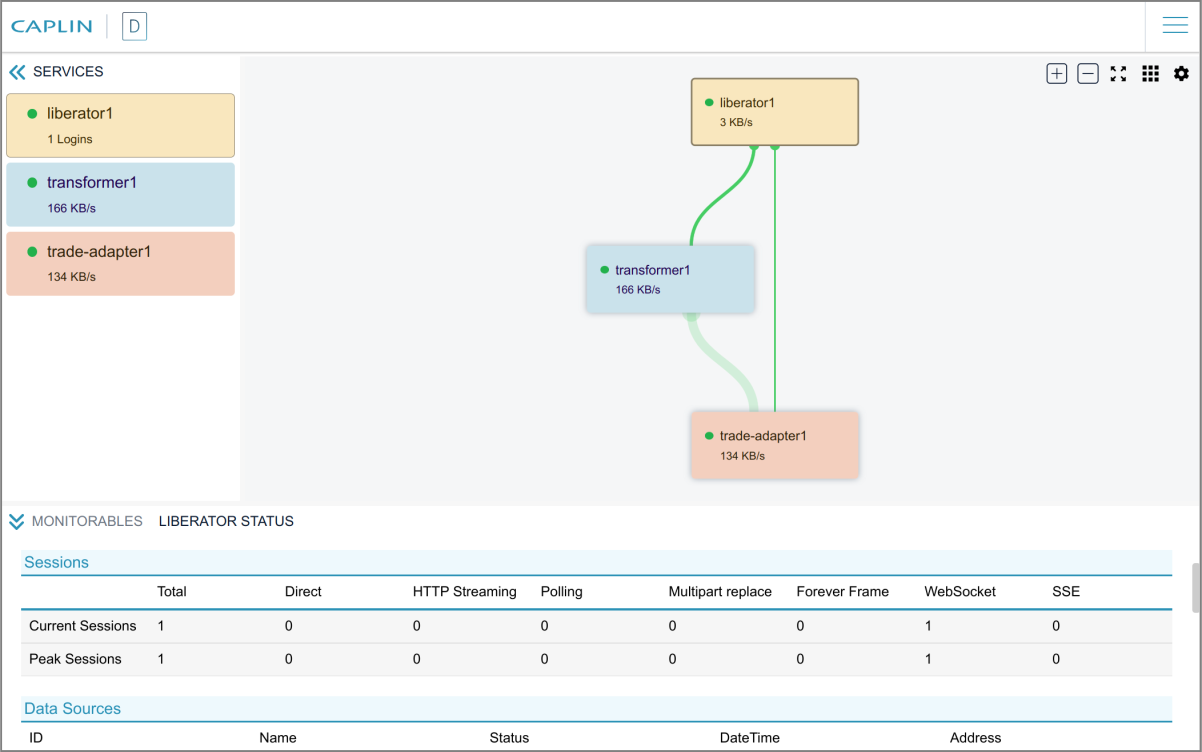
The Liberator component also provides a separate status pane, **Liberator Status**, similar in style to the [Liberator Status Page](../liberator/liberator-liberator-status-web-page.md) published by Liberator’s LiberatorWebsite blade:
Discovery retrieves metrics from components using the following interfaces:
| Component | Monitoring interface |
| --- | --- |
| Liberator | Sockmon |
| Transformer | Sockmon |
| Java DataSource | JMX |
## Metrics
Discovery’s Spring Boot stack publishes JVM metrics at the following URIs:
| Format | URI | Example |
| --- | --- | --- |
| Prometheus | /actuator/prometheus | http://localhost:4567/actuator/prometheus |
| JSON | /actuator/metrics | http://localhost:4567/actuator/metrics |
## Configuring Discovery’s HTTP interface
To change Discovery’s HTTP port number, edit [server.port](discovery-server-configuration.md#server-port) in the Discovery server’s `config/application.properties` file.
To change which Spring Boot actuators are enabled, edit [management-endpoints-web-exposure-include](discovery-server-configuration.md#management-endpoints-web-exposure-include) in the Discovery server’s `config/application.properties` file.